
 Genetic Diversity Indicator – Proportion of populations with Ne > 500
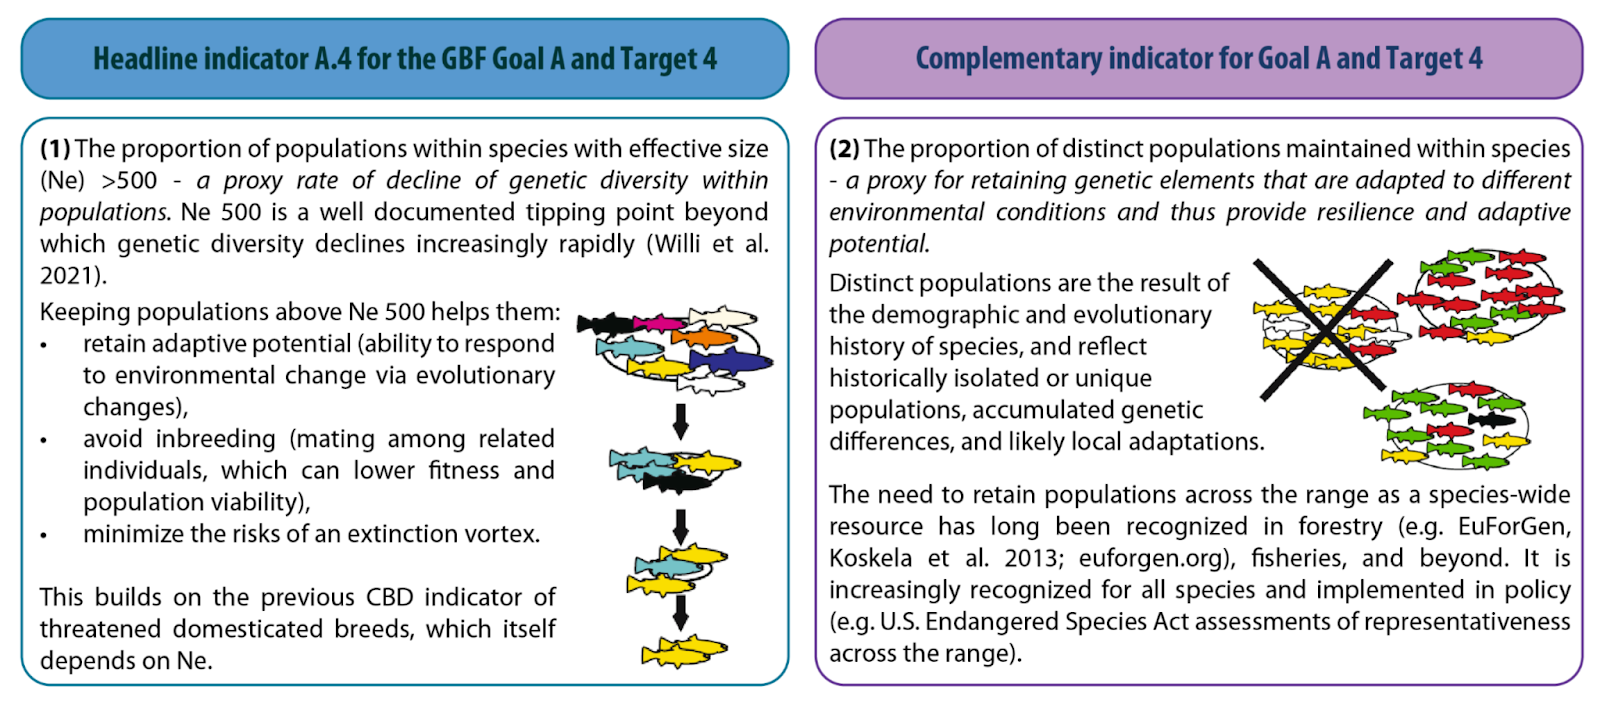
The Ne > 500 indicator measures the proportion of populations within species which are of sufficient size to maintain genetic diversity and adaptive potential. When a population is below a threshold of approximately Ne 500, genetic diversity loss starts to occur, and at population sizes much smaller than this threshold, genetic diversity loss can be very rapid. The ideal state is a value of 1, indicating all populations are of sufficient size (that each population is above Ne 500). The Ne > 500 indicator can be calculated across many species to provide a country level estimate of whether species are maintaining genetic diversity within populations.
| EBV class Genetic composition
Effective population size |
Purpose
To provide a measure of whether species and their populations are able to maintain their genetic diversity. The desirable outcome of conservation intervention is to make sure the effective population size (Ne) of each population within species is Ne > 500. Over time the indicator can be used to determine if the proportion of populations which have Ne > 500 is increasing. The indicator is calculated using diverse local, national and global data, including citizen science and local knowledge, which helps empower countries through ownership of the data, analyses, and outcomes. Note that this indicator is recommended to be complemented by the indicator “Proportion of distinct populations maintained,” and that the below-mentioned resources support both.
Coverage
The indicator can be calculated for as many species as desired, with a recommended 100 species per country to start. It can be calculated for a diversity of taxonomic groups, and has been demonstrated for vertebrates, invertebrates and plants. The indicator should be re-calculated, ideally every five years if resources are available.
Methods
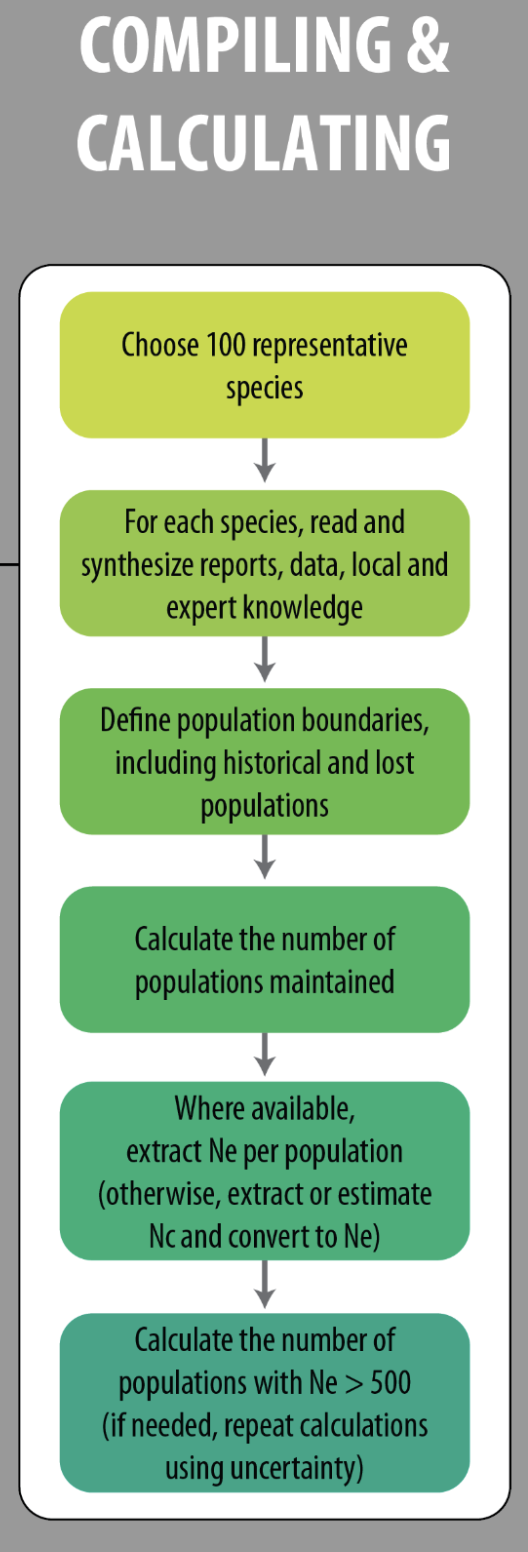
The Ne > 500 indicator is calculated using a variety of data sources on population sizes. It can be calculated directly using DNA-based analysis for some species, but currently, in most cases and for most countries, it will be calculated using an estimate of population census size and a transformation of census size (Nc) to effective size (Ne) using a ratio of 0.1 (Ne:Nc; by multiplying Nc by 0.1 to obtain Ne). This is performed for each distinct population, each population Ne is compared to 500, and the proportion of populations above the threshold is calculated.
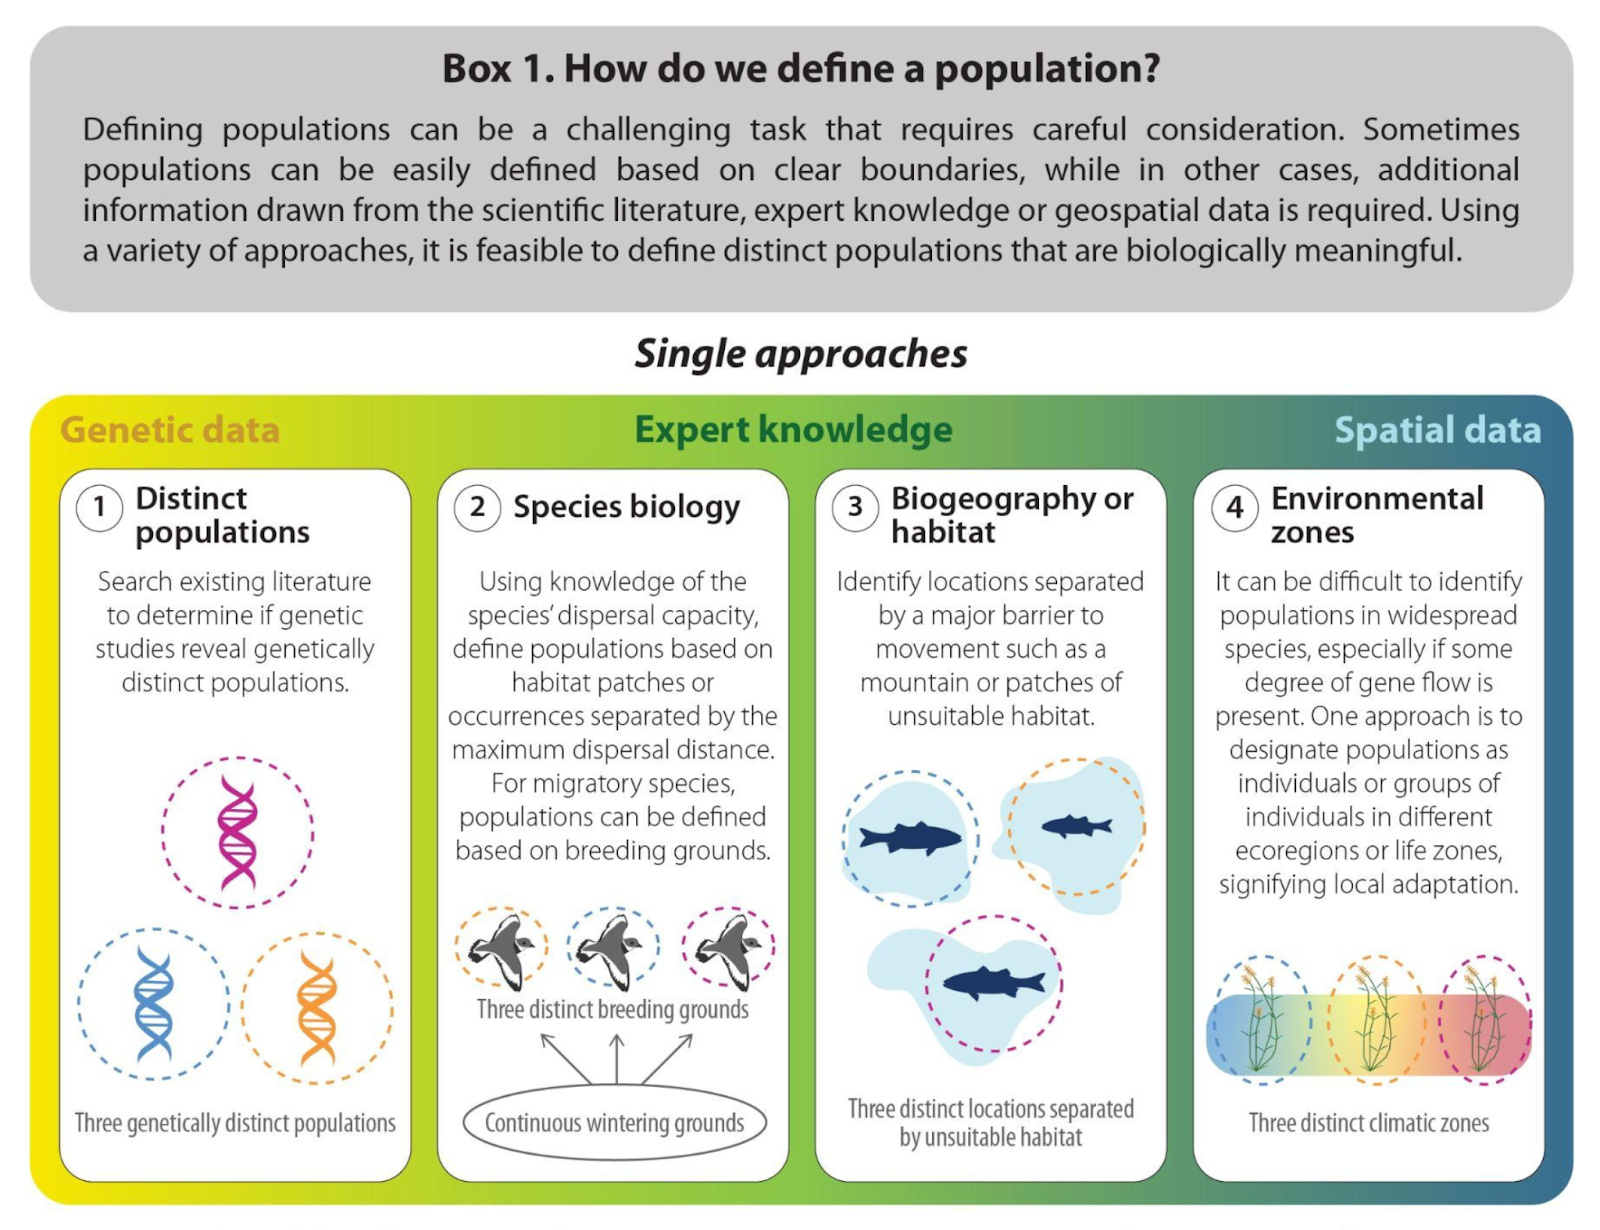
Therefore the necessary methodology is to: define populations, estimate their effective or census size, and compare this to the Ne 500 threshold. Importantly for country implementation, the approach is flexible and allows for the use of a wide range of knowledge and data. The estimate of census size can come from national and local monitoring efforts, published literature, surveys or inventories, consulting local people, citizen science, or even estimates of occupied habitat area if density is also known. Local knowledge and local resources can be leveraged. An exact census size is not needed; even vague information such as “less than a few hundred” is sufficient. Gathering this information takes on average 2 to 3 hours per species.
Populations can be defined flexibly, using geographic barriers, ecological differences, or other knowledge. When there is uncertainty in either Nc or population boundaries, multiple values of the indicator can be recorded by conducting multiple assessments.
A national indicator value is calculated by averaging the values across species for different taxonomic groups, ecosystem types, or other disaggregations.
To help others use this indicator in a fully transparent, open fashion that leverages in-country knowledge, we have made available a detailed guide to the procedure, a custom designed tool for recording indicator values in a standard fashion, and a set of calculations in a FAIR (Findable Accessible Interoperable and Reproducible) code repository.
Further resources
- A summary of essential resources and policy briefs on genetic diversity indicators was prepared for SBSSTA25 and it is available here.
- Recorded webinars relating to genetic diversity indicators
- UNEP WCMC webinar – 4 Mar 2022 https://www.youtube.com/watch?v=-UJx0s3M6nc (This webinar presents multiple headline indicators; the genetic indicator segment starts at 34:45)
- GEO BON | CBD webinar in advance of COP15 – 16 Nov 2022 (This webinar presents the concepts of the genetic diversity indicators as well as initial results from application in multiple countries, including case study examples) https://www.youtube.com/watch?v=hDVBbE8cRv8
- GEO BON | CBD indicator webinar presentation – 26 July 2021 (This webinar presents background on the importance of genetic diversity and different ways to measure it, including using indicators) https://geobon.org/genetic-diversity_2021-07-26/.
- Guidance documents, data collection tools, and analysis scripts for applying Headline Indicator A.4 and Complementary Indicator on proportion of populations maintained have been produced for the monitoring framework of the KMGBF. Parties can directly use these resources for calculating indicators for their National Reports due in 2026. Parties may wish to examine these materials in advance to plan for allocation of time and resources to calculating these indicators. Please note these are in first draft form and updates are forthcoming in early 2024:
- Indicator Guidance document available as pdf here. This document includes definitions on key terms (e.g. what is a population), and information on how to select a species list and what types of data sources could be used.
- Online data collection form using Kobotoolbox, a free and open source tool that allows to easily develop digital data collection forms. Data can be collected from different devices and people, and is accessible through the KoboToolbox interface. This data can then be downloaded into multiple formats for use in applications such as Excel, R, Python.
- Genetic Diversity Indicator Testing Kobo Manual available as pdf here. This manual provides detailed advice on how to answer each question, with examples.
- R scripts for estimating the indicators available here.
- A work plan of academic and governmental institutions of nine countries that used these indicators (explaining in particular some of the data sources used for collecting data) can be found here, with preliminary results available here. An overview of some considerations and advantages of these indicators can be found here.
- An overview of the larger context of genetic diversity conservation and monitoring can be found here. A detailed tracking of the development of Target 4 and Goal A text on genetic diversity over the development of the GBF can be found here. This document also notes the relevance of genetic diversity to the other targets noted above (Targets 1, 3, 5, 9, and 12)